Table of Contents
One of the best ways to make your business more popular is to use infographics. It has been used in content marketing plans for years and is still popular. They are creative and very good representations of the business philosophy which you should try to convey. While creating infographics, the designers would like to use different elements like charts, images, graphics and colours. 90% of information your brain receive is visual so it’s very easy to understand.
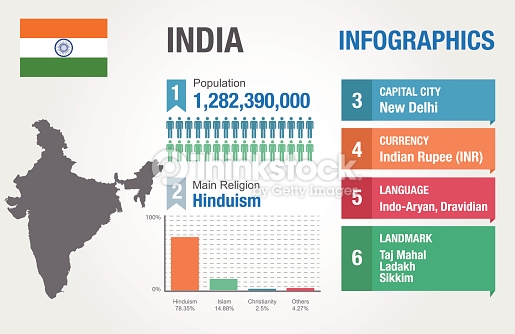
All of the elements will help you talk about your business in a way that people are able to understand better. To know about the role of infographics in your content marketing plan, give this post a good read!
How can you design infographics?
In order to design infographics, you have to use images, statistics, icons, drawing and colours of all kinds. Apart from that, you have to use brief text regarding the business. In designing infographics, the elements and texts have to be presented in a way that is precise. The aim here is to show that the message and statistics are used in visual manner. There are several sites like Designhill which can work well when it comes to creating infographics designs. You may take some help from professionals as well.
If you have’nt used them before, here are a few reasons that can help you convince your business partners to add infographics in the content marketing plan.
1. Infographics are known for better visual appeal
Most studies have shown that around eighty percent of information that is sent to the brain happens to be visual. The attention span of people who watch your content is not always that long. It is short, very natural and can be helped if infographics are used.
Infographics have been used for better and quick scanning of the content. This is different from the traditional methods which are used for reading paragraphs and business ideas. Infographics will help in attracting people who like the use of good images and bright colours.
2. People want to share them
Infographics are also a very interesting and easy way to boost your content marketing. This is why most people want to use them in their plan. The audience tends to grab a lot of information in a way that is less stressful. They are also very much likely to share a lot of articles and blogs if it comes with a lot of infographics instead of essays and articles that are too lengthy.
On average, companies which start using infographics grow 12% faster than before.
You may also use some Google analytics if you want. It will help you track how most people are engaging with other blogs which have more infographics. Also the infographics could be shared with different networks that can help you plan better.
3. Builds awareness of the brand
The infographics used are very effective as marketing tools when it comes in building better brand awareness. This is because visuals can be used in content which can convey the business message towards the audience very easily so that the brand will stay in the memory of those who are viewing the video for a very long time.
You may also use infographics for marketing activities online. An example can be used to describe this. This includes sidelines of event as well as brochures which can promote the services and products. However you have to ensure that the infographics designs are done professionally by designers. For more ideas, you could also go through a few pages of the website.
4. It can go viral quite fast
Since most infographics are very attractive and helps people share them on social networks, the chances are definitely becoming viral and are much higher than a regular text content. Experts have also revealed that the blog where infographics production have boosted by one percent have shown much more progress than ones that didn’t.
It has helped the post go viral and does not even evoke any doubt towards the viewers. In short, infographics are successful as you know that no brand will be misleading the information whatsoever.
List of best infographic online tool
1. Canva Infographic Maker
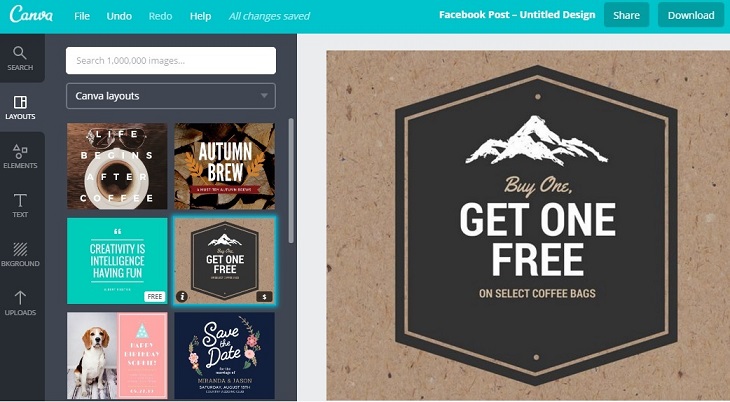
2. visme

3. vizualize
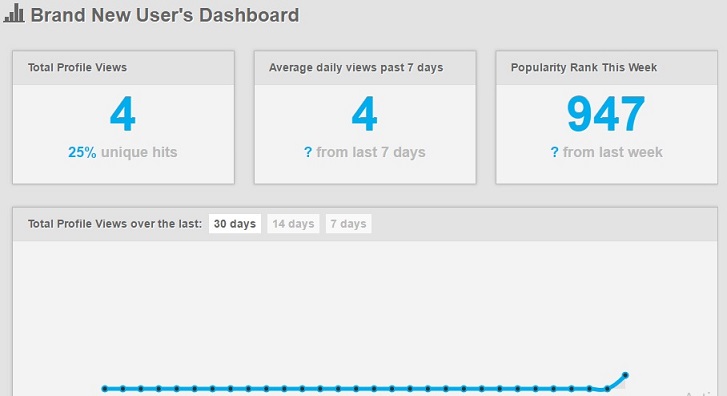
4. piktochart
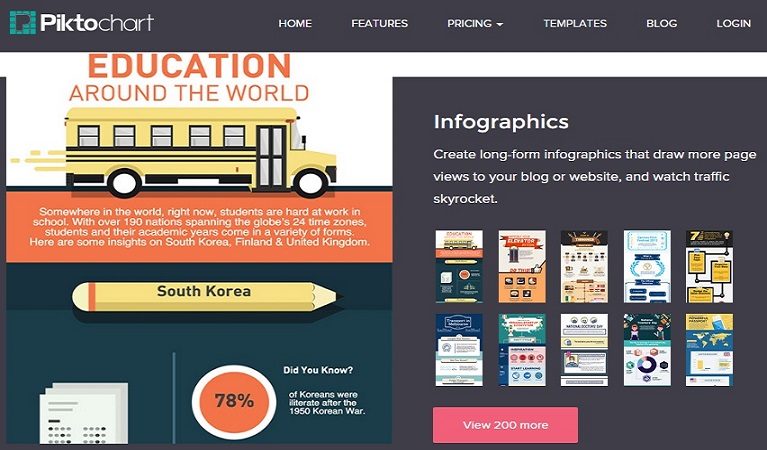
5. Infogr
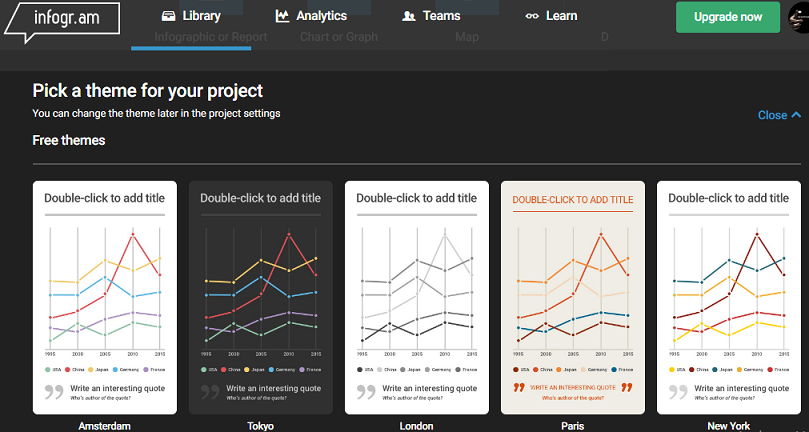
6. easel
Design infographic easel
Conclusion on role of infographics in content marketing plan
The main prerogative of representing data is to display information in a very organized and neat manner. The human nature is subjective whenever it comes to reading data as well as information. By using the right infographics, there will be a much lesser chance of misinterpreting the figures and facts.
Also by using data analytics, the infographics will also make data much enjoyable and simple. The designers that choose to make new infographics using elements which are smoother to hold and very easy to hold. You can choose colours or shapes of your choice to make data more appealing. It will also educate the viewers. One must start a very effective infographic which will demand better skills and even more creativity.


